In this final blog post of the series, I will discuss the Client-Side Monitoring configuration of APM and will show how to generate alerts within your demo/lab environment to test the APM features of SCOM.
Client Side Monitoring
Now that we have created our server-side monitor, we need to configure the client-side monitoring for our application. Client-Side Monitoring uses JavaScript scripts that are automatically added to each managed web application that you configure for monitoring. To ensure these scripts can run properly and safely against your application, we need to check it for compatibility.
Click on the Monitoring tab on the SCOM console wunderbar, expand the Application Monitoring folder and then click on the ASP.NET Web Application Inventory view to see your applications listed.

We can use the ‘Check Client-Side Monitoring Compatibility’ task from the Tasks pane on the right hand side to verify that the web application can be safely monitored using client side monitoring.
I recommend running this task as part of your initial application monitoring configuration to confirm that it can be monitored without any issues. The screen below shows the output from this task

Once we have a successful return from the Client-Side monitoring compatibility task, we can then go ahead and add the client-side monitoring feature to the newly created APM monitor.
To do this, go back to the Authoring tab on the wunderbar, expand Management Pack Templates, click on the .NET Application Performance Monitoring view and then double click on your new APM monitor (in this case it’s the DotNetNuke one as below) and then select the Client-Side Monitoring tab from the resultant window

From the screen above, enable the check box beside your application component and then click on the Customize button over on the right hand side to review the various customizations that you can apply to your monitor
The screens below show examples of some of the customizations you can make to your APM monitor


Once you are happy with your changes, click on the OK button twice to return to the main SCOM console. This will now enable some additional views within the Monitoring tab of the console and we can click back over here to take a look at what we have now for our .NET application.

Staying in the Monitoring pane, scroll down the list of folders on the left hand side and expand the Operations Manager folder. Now expand the ‘APM Agent Details’ folder and take a look at some of the alerts that have been raised in here. These alerts will normally indicate that you need to restart IIS or recycle an application pool on the server that you have configured APM monitoring for. See below for an example of these alerts

With this knowledge, it’s a good time to logon to your IIS server that is hosting the .NET application and take a look in the ‘services.msc’ snap-in and you will notice that the ‘System Center Management APM’ service is now Started and set to Manual. This service is installed by default as Disabled and only changes to Started when you configure the Client-Side monitoring functionality of SCOM APM.

It would also be a good time now to restart IIS on this server if you can. I’ve simply opened the IIS Management Console, clicked on the Server Name and then chose the ‘Restart’ option from the Manage Server pane on the right hand side

Testing APM
So, what do you do if you have followed the steps in these posts to the letter and have configured your APM perfectly but there are no issues within your application to test if your setup is working or not?
Simple, we create a bogus page within our application that when called on, will throw up an error for SCOM APM to deal with!
(Thanks to Paul Keely - System Center Cloud and DataCenter Management MVP for this tip!)
Simply copy the text below into notepad and save it as test.aspx into the root folder directory of your .NET application:
<%@ Page language="c#" %>
<%@ Assembly Name="System.Data" %>
<%@ Import Namespace="System.Data.SqlClient" %>
<form id="Form1" action="Default.aspx" method="post" runat="server">
<%
using (SqlConnection connection = new SqlConnection("Server=server;Database=database;User ID=user;Password=password;"))
{
connection.Open();
}
%>
</form>
The root folder of my .NET IIS based application is: C:\inetpub\wwwroot\dotnetnuke
When I copied the file to the above location, I simply browse to the following URL:
http://IIS-LAB/dotnetnuke/test.aspx
This will then throw up an error page like the one below
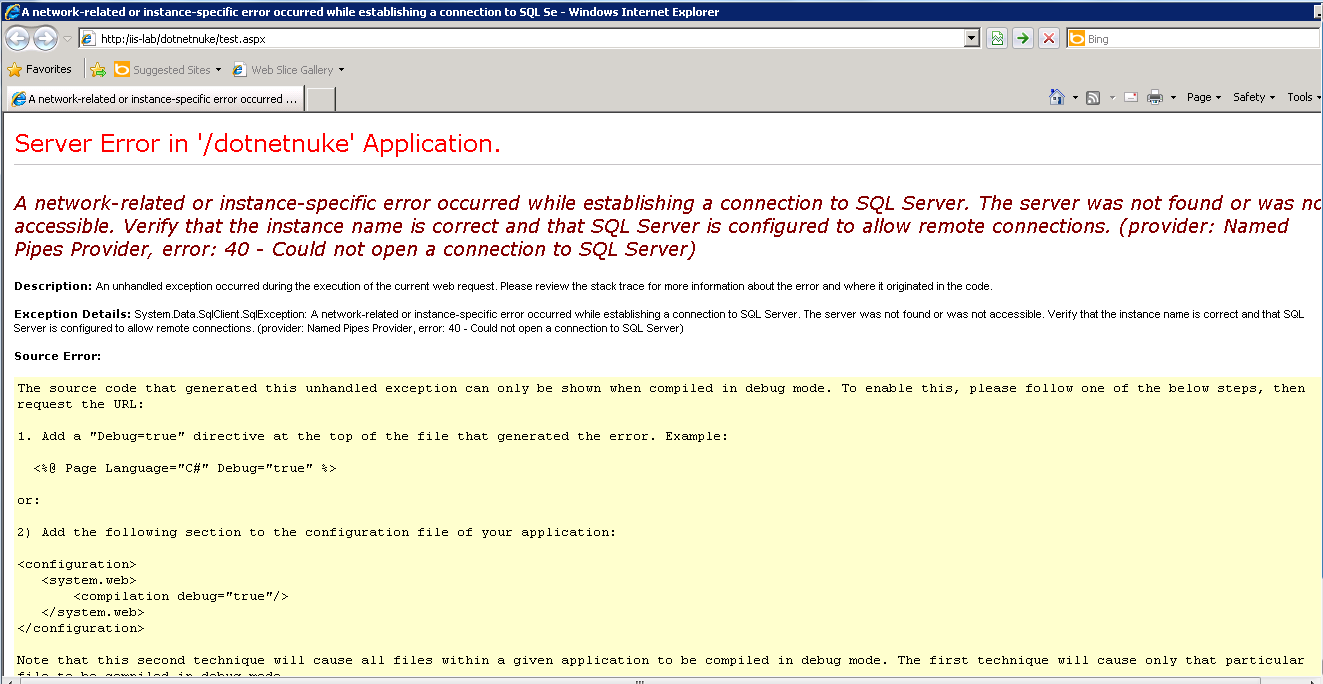
Which in turn, will manifest itself within SCOM as

If you click on the blue URL link within the alert, it will open up the AppDiagnostics console (which is installed when you deploy the SCOM Web Console), and you will see the results of the error diagnostics as below

You can also review Performance counters from the screen below

This concludes your configuration of the APM feature in System Center 2012 Operations Manager. Although we've covered a lot in these three posts, there's still a huge amount that wasn't talked about. If you've gotten to the point where you have APM working and at least a demo application being monitored, then you will be in a great position to explore deeper into the different thresholds and customisations that are available for your application monitoring.
Update March 2014: Check out the following links to some other posts that I've written if you want to learn more about APM:
SCOM 2012 - APM CSM vs. GSM and Web Application Monitoring....Confused?
SCOM 2012 - The APM Consoles Part 1 - Application Diagnostics
Application Insights Deep Dive - Getting Started
Enjoy!
Outstanding! Thank you!
ReplyDeleteNo problem Walter - thanks for the comment!
DeleteKevin.
Kevin, you rock.
ReplyDeleteI really appreciate all of your hard work and effort.
And looking forward for more :)
Hi Kevin,
ReplyDeleteI did all steps and after creating the error page no alerts found in SCOM.
Do I need to wait for more time? If yes how we can make it faster to use it in demos.
My e-mail is : fireblade_music@hotmail.com
Thank you in advance, and you rock again :)
Hi again,
ReplyDeleteNow I know what was the problem, I just need to restart the IIS server from the alert in the SCOM itself not from the IIS management maybe due to some delay between the client the server.
Thank you Kevin
Hi there,
DeleteYep, the restart of IIS is one that catches a lot of people out when deploying APM for the first time. Glad you got it sorted anyway.
Thanks for the great comments,
Kevin.
Hi Kevin/Community,
ReplyDeleteI have created alerts of IIS application pool failures. However, how can I go about setting it up, such that, if the app pool fails/stops for whatever reason, SCOM can trigger a restart on the app pool?
Hi Ravi,
DeleteThanks for the comment!
If you want SCOM to trigger a particular action after a specific alert is generated, then you can simply create a recovery task to run automatically and to restart the app pool.
See this link for more information:
http://technet.microsoft.com/library/hh705258.aspx
Be warned though, that it generally isn't recommended to have a recovery task restart app pools automatically as you most likely have an underlying issue that needs to be dealt with that might not be noticed if the app pool keeps getting started up again.
Also, my preferred way to trigger any type of diagnostic action is to deploy System Center 2012 Orchestrator with SCOM 2012 integration. This works really well and allows for a more granular approach to your requirements.
Hope this helps,
Kevin.
Hi Kevin,
ReplyDeleteI had followed the guidelines and was able to get the desired alert. but one day after, i am getting no alert. I have restarted IIS on both Application Server and SCOM. restarted the servers itself many time, removed the .NET application and configured again from scrtch, removed the custom Management Pack and created new but i am not able to get the alerts. tell me what else i need to check?
Junaid Ahmed
Hi Junaid,
DeleteSorry for the delayed response. Check out the link below for an alternate method on how to generate APM errors in your application:
http://blogs.msdn.com/b/sergkanz/archive/2011/08/12/scom-beta-with-application-monitoring.aspx
Kevin.
Everything seemed to work fine. A couple of my servers are not starting the System Center - APM service. I am manually having to log into the server and turn on the service.
ReplyDeleteHavent seen this myself Matt but have you checked the SCOM agent version on the servers that the APM service isnt starting from?
DeleteYou might need to apply the latest Update Rollup 3 package to them.
Kevin
Excellent 3 part series Kevin... I'll be linking this on a blog post I'm working on for a little known CSM troubleshooting tool!
ReplyDeleteThanks Stephen - appreciate the comment :)
DeleteLet me know when you've finished the blog post on the CSM tool.
Kev
Kevin,
ReplyDeleteThanks for the guide! Can you tell me why an application gets discovered OK and is viewable in the main console, but is not listed as a Source in AppAdvisor? I'm at wits end ... :)
Thanks!
Great, I followed to the last step to create the test.aspx
ReplyDeleteHowever, I didn't get the sql connection error, just the server runtime error
I am on IIS 8 though
I have imported IIS 8 MP of coz, and the DotnetNuke demo page is running fine
Kevin, very good post on APM. Quick question regarding "client-side-monitoring" is there any cost (performance per say) associated with enabling this option? Have you seen any issues with SCOM APM pushing these JAVAScripts scripts to clients?
ReplyDeleteThanks in advance